The cTrader Mobile 4.6 version delivers shared account access functionality, along with multiple valuable improvements of charting: drawing style via taps, 7 new drawings, magnet mode, and chart-related menu settings improvement.
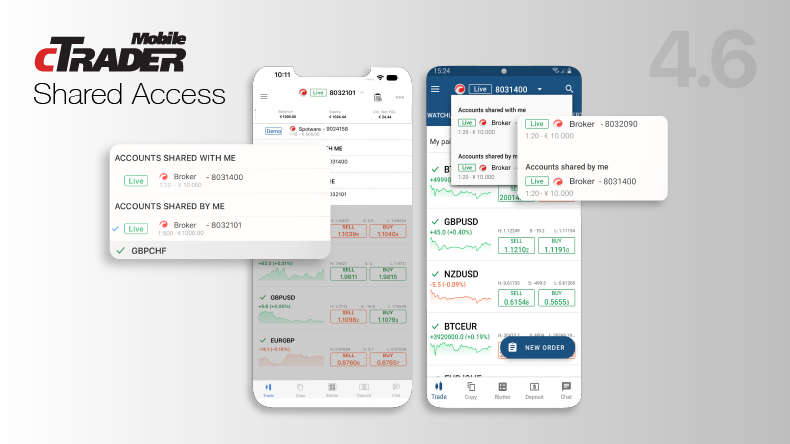
Shared Account Access
Users can now share, revoke and reject access to trading accounts, granting portfolio managers the chance to trade on their behalf. Addition and withdrawal of funds, as well as copy trading are not permitted. The feature is available exclusively via the cTrader Crossbroker Apps.
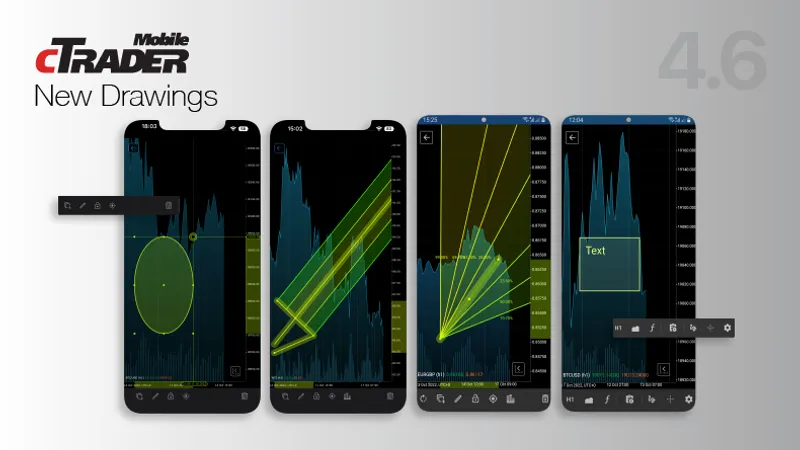
New Drawings in Charting
We have come up with a whole blast of new drawings on Mobile, bringing the Mobile experience above-and-beyond capability, providing a new level of technical analysis on-the-go for our users.
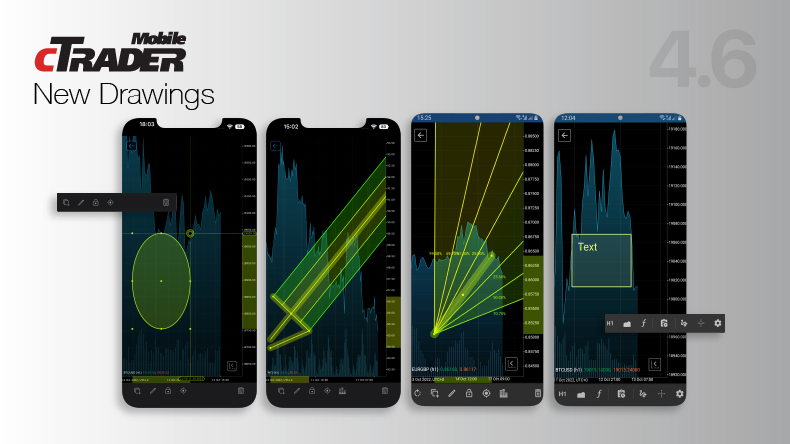
Fibonacci Arc drawing
The arcs mark potential support or reversal zones to watch as prices pull back after the advance. After a decline, Fibonacci Arcs are used to anticipate resistance or reversal zones for the counter-trend bounce.
Ellipse drawing
An Oval shape drawing. Select Ellipse from charting and see the drawing appear immediately on your chart. You are then free to modify the oval, just like any other drawing: enlarge, stretch, move, change color, opacity, line width and type etc.
Text drawing
Users can now add text to their drawings in order to make more sense of your technical analysis, helping you get organized & see a clear picture.
Fibonacci Expansion drawing
Fibonacci Expansion is a charting technique used to plot possible levels of support and resistance by tracking not only the primary trend but also the retracement. The tool is very similar to the Fibonacci Retracement, but it is also intended to determine the end of the third wave.
Fibonacci Timezones drawing
Fibonacci Time Zones are a series of vertical lines, used to break down a certain time period into smaller ones whose lengths are consecutive Fibonacci numbers. Unlike other charting techniques, Time Zones focus on the timing, rather than the price component of price movements.
Fibonacci Fan drawing
A Fibonacci Fan is a charting tool that is used to estimate support and resistance levels by drawing the trend lines based on the Fibonacci Retracement levels.
Andrew’s Pitchfork
Andrew's Pitchfork is a technical tool that helps identify possible support and resistance levels as well as potential breakout and breakdown levels with three or more parallel trend lines that look like a pitchfork. Andrews Pitchfork is convenient in defining support and resistance. We at cTrader offer 3 Pitchfork variations: Andrew’s, Schiff & Modified Schiff.
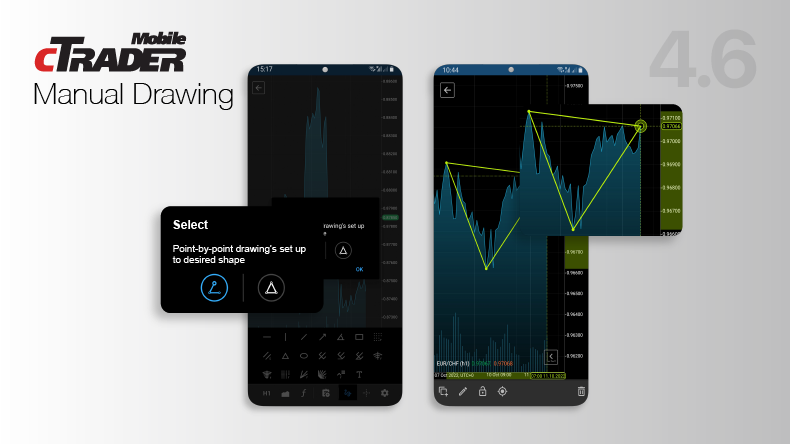
Manual Drawing Mode in Charting
One of the top user-requested features has been to add drawings point by point. Now users can just tap on the screen to place points, and they will join into one of our available geometric shapes. The shape appears on the chart immediately, and users can modify and move it as they please.
Charting Magnet Mode
Users can now use Charting Magnet Mode to increase convenience and drawing precision during technical analysis. Drawing points will by themselves snap to the charting line. Users can choose either a weak magnet or a strong magnet, depending on their preference.
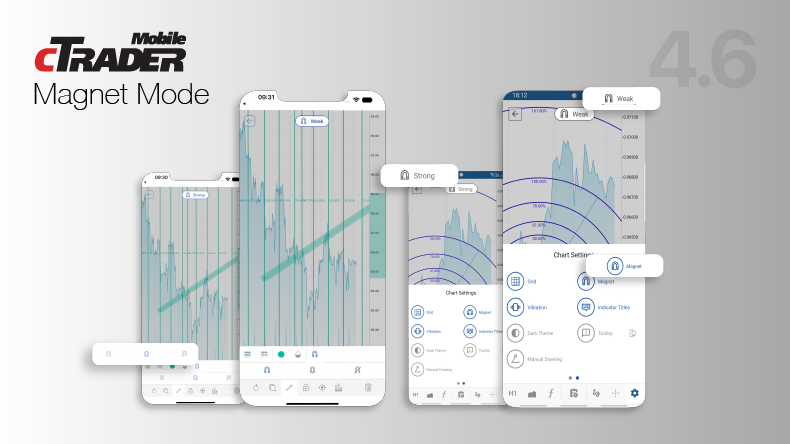
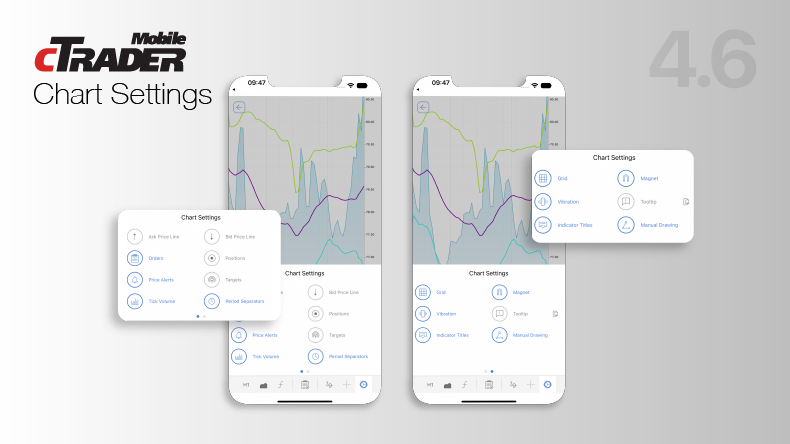
Chart Settings Improved View
We have improved the chart settings UI, going from a simple list to large user-friendly icons.
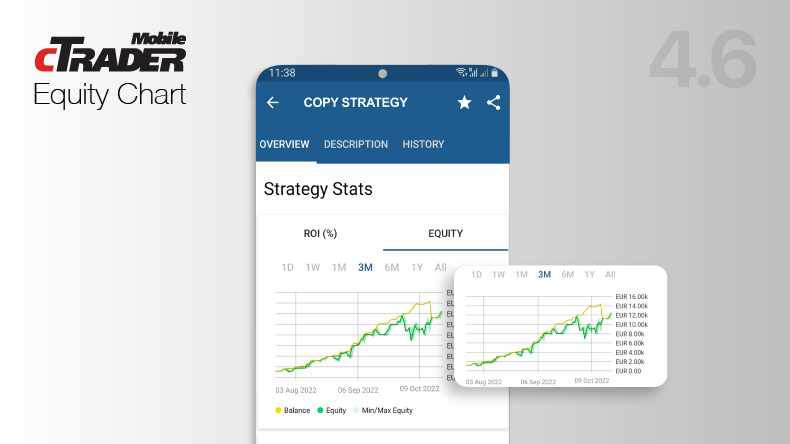
cTrader Copy: Equity Chart in Strategy & Investment
The strategy & investment screen now has 2 charts – the ROI and the newly-added Equity. The Equity Chart shows the amount of own funds the provider has invested into the strategy, drawdowns, as well as his deposits & withdrawals. One can use this chart to evaluate potential copy trading risks of the strategy in question.
To try the new features, please download cTrader Mobile 4.6 via Google Play or App Store.