We are delighted to announce the new cTrader Desktop 4.3 release, packed with a wide variety of technical analysis tools for the trader, including new chart types and trading convenience enhancements!
With the new version, cTrader Desktop now also supports account names, eliminating the need for traders to memorise account numbers, and adds a variety of technical analysis tools, including superior-analysis-intended charts, among which the HLC chart type and Area chart type, and the synchronized crosshair feature, useful for multi-frame trading.
Additionally, holidays and future contract expiration dates can now be added in the Market Hours window by brokers, allowing traders more transparency in symbol data, and ability to plan their trading activities more efficiently.
Download cTrader Desktop 4.3 Beta
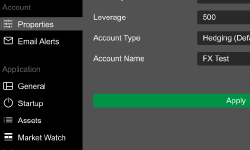
Account Names are now supported
Users are now able to name their accounts, eliminating the need to remember their account numbers. It will help set up their list of accounts as they want: either per strategy or per group of symbols, simplifying account management.
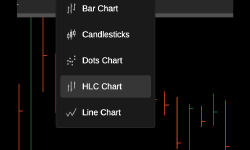
HLC Chart Type
HLC chart type has been added to the chart types providing yet another chart option to traders. An HLC bar is a vertical line connecting the High and the Low price points representing the range of an instrument's price movement over a defined interval. A short horizontal bar, perpendicular to the High Low, shows the price at which the instrument closed.
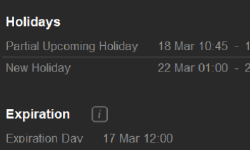
Holidays & expiration days in the Market Hours window
Holidays, set up by the broker, will appear on the calendar on the days they occur. Traders will also be able to see information about expiration dates of futures contracts. This results in more transparency in symbol data, and ability to plan trading activities more efficiently.
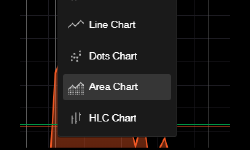
Added Chart Type: Area
Area chart type has been added to the chart types too. The Area chart type is similar to the line chart, with the difference being that the area below the line chart is filled with a specific colour. Traders can use the area chart to easily visualise the long term past movement of the price.
Area charts have several key uses. Firstly, they can depict the growth of an investment over time, making them a common tool to showcase a fund's past performance. Secondly, area charts can be used as a trading instrument chart for price behavior analysis.
The Area Chart, also known as a Mountain Chart - is one of the best options of how to look at a fund's past performances, making it easy to read and use for the future deals.
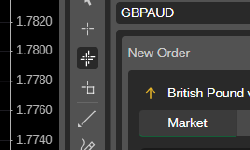
Synchronized Crosshair
The Synchronized Crosshair tool allows traders to drag the crosshair on one chart while replicating it on multiple open charts, making multi-timeframe technical analysis much more efficient and productive.
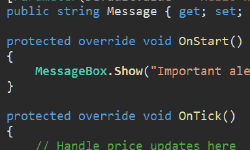
MessageBox in Automate API
From now on, algo developers can use the MessageBox to interact with users. It replicates the API of standard MessageBox from WPF, without any limitations for developers, such as access rights to user PC, and perfectly fits the style and color-scheme of the cTrader interface.
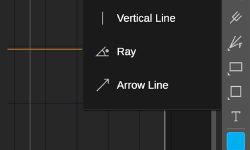
Arrow chart Drawing Tool
The arrow chart drawing tool allows you to point out features of the chart, typically either price movements or indicator/study movements.
Chart Sorting in different Chart Mods
You can now sort & synchronize the charts in different chart mods - Single, Multi, Free.