News
Latest updates of our fintech products, awards, interviews and & top-tier industry media publications.
Autochartist Market Analysis Added to cTrader Mobile
May 08, 2019
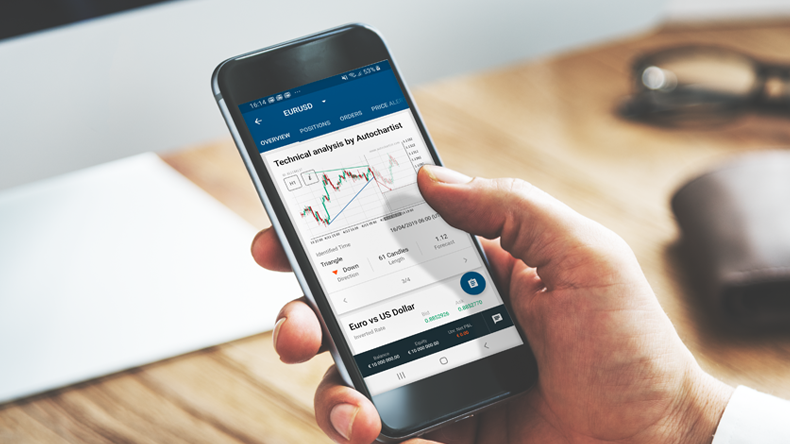
To provide traders with more information and functionality to help them make better trading decisions, we have integrated Autochartist Market Analysis to cTrader Mobile 3.4 Beta for Android and iOS apps, available to all users. It will be also released to brokers who are subscribed to Autochartist services.
Autochartist identifies potential trade opportunities using Chart Patterns, Fibonacci patterns, and Key Levels. The analysis is generated per symbol, for timeframe as low as 15 minutes, providing traders with a graphical illustration and information on the direction of potential price movement along with the forecasted price.
In cTrader Mobile, the Autochartist Analysis tool is located in the Symbol Overview section. For more information, users can open Pattern Details which offer a full overview of the pattern. Orders can be quickly placed in both screens of the app providing a seamless trading experience.
This integration equips traders with an essential tool for technical analysis from a market leader and helps newer traders get acquainted with different technical analysis concepts and gain extra validation of their own analysis.
We also plan to release Autochartist Market Analysis on cTrader Web as soon as possible.
Download cTrader Mobile 3.4 Beta with Autochartist Market Analysis from Google Play or App Store. For live trading, please consult with your brokers for availability.