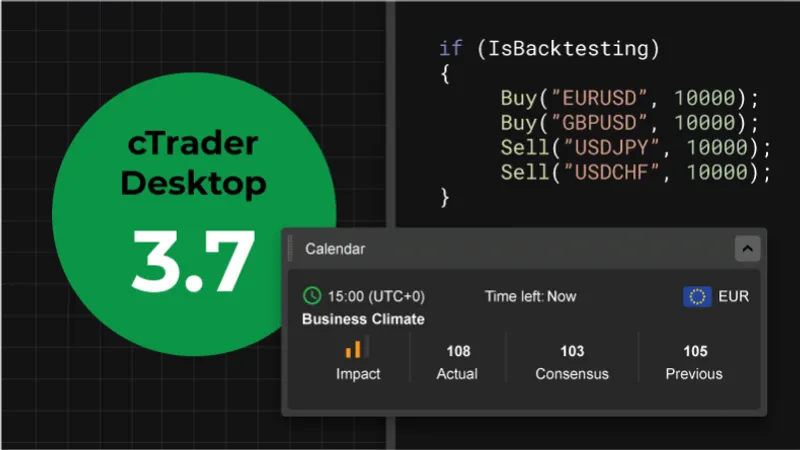
We at Spotware are pleased to announce the release of cTrader Desktop 3.7 version. The update comes equipped with a whole series of enhancements for a complete trading experience, including a fully-integrated FXStreet Economic Calendar, previously made available in cTrader Web, as well as Multi-Symbol Backtesting for cTrader Automate.
Download cTrader Desktop 3.7 Beta
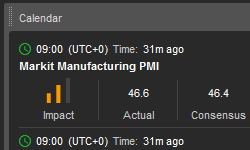
FXStreet Economic Calendar
One can now observe the full list of economic events for a complete Fundamental analysis without leaving the trading platform. The Active Symbols Panel has been equipped with a list of economic events for each selected symbol.
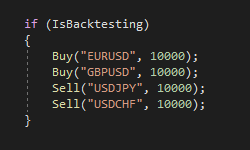
Multi-Symbol Backtesting for cBots
cBots have been vastly improved to use other symbols during backtesting. This comprises the ability to perform trade operations, get historical data, subscribe to tick events and analyze indicators.
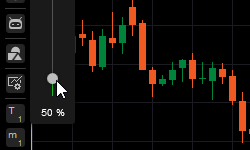
New Chart Zoom
Charts have been improved with a new smooth zooming function. Furthermore, one can now zoom in and out via a simple shortcut: Ctrl + Mouse scroll.
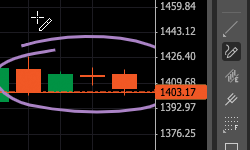
Freehand Drawing Tool
The new Pencil tool now allows freehand drawing on charts for increased customization and convenience.
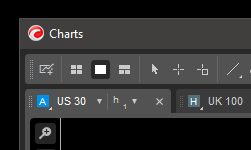
Detached Chart Containers
Detached windows can now contain multiple charts with own charts layout for the bigger picture view. Detached chart containers further comprise their own drawing instruments’ toolbar, and charts can be easily moved between containers and the main window via a simple drag & drop function.
Hide Sensitive Information
For increased user privacy purposes, all sensitive information, including account number, account balance and cTID name can now be hidden from the screen. These settings can be found in the General Settings section.
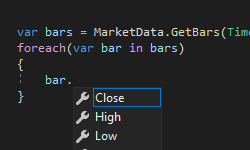
New Historical Data API
Historical data API has been equipped with a variety of new features and API usability improvements.
MarketData possesses new methods of: GetBars, GetBarsAsync, GetTicks, and GetTicksAsync. These API methods work for current and other symbols in both - real-time and backtesting.
Further, new API methods have been added to load more history.
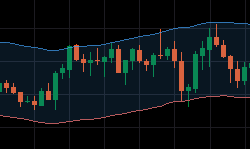
Clouds Between Indicator Lines
Developers now can use clouds between indicator lines. A cloud can be added using a single attribute with 2 line names, such as:
[Cloud("UpperBand", "LowerBand")]
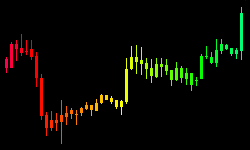
Bars’ Custom Color Using API
cBots and indicators can now change individual bar colors using new API methods: SetBarColor, SetBarFillColor, SetBarOutlineColor, and SetTickVolumeColor.
Other UI Improvements
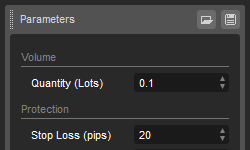
Automate Parameters Panel
For quick access to cBot and indicator parameters in the Automate section, traders can now use the new Parameters Panel. The panel is visible by default, but can be hidden using the Layout menu.
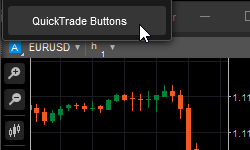
Show/Hide QuickTrade buttons on chart
New chart setting now allows to show or hide QuickTrade buttons.
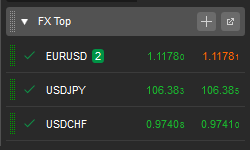
Positions Count Badge
The new Positions Count Badge function displays the number of opened positions per each symbol for increased trader standing visibility.
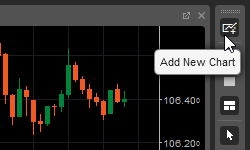
Add New Chart Button
An Add New Chart Button option has been added to the main toolbar for swift access. New charts can now be added in a click in both - Multi-Chart and Free-Chart mode.
cTrader Desktop 3.7 will be released to all brokers in the nearest future. In the meantime, you can try all the new features out on Beta.
Download cTrader Desktop 3.7 Beta
If you wish to discuss the updates, or ask any follow-up questions, please refer to our Community Board, or the cTrader Official Telegram channel.