News
Latest updates of our fintech products, awards, interviews, media & top-tier industry publications.
cTrader for Windows and Web Updates, January - April 2014
Apr 01, 2014
Performance TabNow you can analyze your historical trades using Performance tab. Mouse over balance line to get information about Balance and Drawdown. Click on balance line to navigate to the corresponding deal.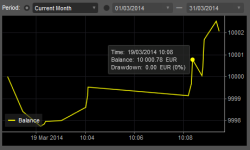
Historical trades accessNow it is possible to retrieve the historical trades from cBot or Indicator. The History collection contains the same items as History tab in cTrader. 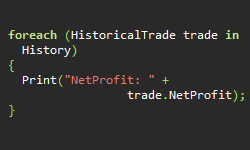
Tick ChartsTick Charts are now available. You can view either a 1-tick chart or an aggregated tick chart of up to 55 ticks. Tick charts can be used with any chart type and any indicator. 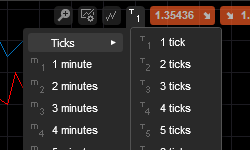
Advanced Take ProfitYou can now set up to 4 Take Profit levels for a position. Each take profit level can be set to close a part of the position's volume. 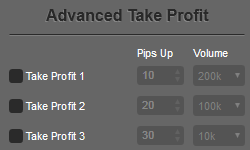
New Chart Type: Dot ChartsDot Charts plot a round dot at the close price of the time period. 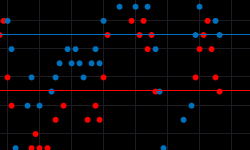
New TimeframesWe have included two new timeframes in cTrader, m6 (6 minutes) and m20 (20 minutes). 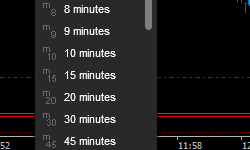
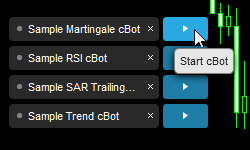
Run cBots in cTraderNow you can run cBots in cTrader. Just drag the cBot from the cBots tab located in Market Watch to one of your charts, configure your parameters and press play.